B2B | SaaS
Dashboard for a SaaS Installer Services
Shaping the entry point for installation companies to access a SaaS with actionable daily workflows
Lean
early assumption validation
Faster
access to daily priorities
Reduced
refresh behavior
zolar Installer Services Dashboard
B2B | SaaS
Dashboard for a SaaS Installer Services
Shaping the entry point for installation companies to access a SaaS with actionable daily workflows
Lean
early assumption validation
Faster
access to daily priorities
Reduced
refresh behavior
zolar Installer Services Dashboard
B2B | SaaS
Dashboard for a SaaS Installer Services
Shaping the entry point for installation companies to access a SaaS with actionable daily workflows
Lean
early assumption validation
Faster
access to daily priorities
Reduced
refresh behavior
zolar Installer Services Dashboard

Product
B2B SaaS
Industry
Energy & Greentech
Timeline
Q4 2024 - Q1 2025
My role
Product Design, UX Research
Tools
Figma, Miro, Hotjar, Google Analytics
Challenge
As zolar Installer Services gained its first users, there was no clear entry point for them to access priorities, projects, and tools. This created an opportunity to design a dashboard as the first touchpoint with the SaaS, surfacing the right information to support workflows while aligning with zolar’s strategic goals.
Approach
The first MVP was rapidly designed and shipped to test internal assumptions. We then conducted field research, data tracking, and a Partner Forum to test and align the dashboard more closely with installer workflows and priorities.
Key Insight
A dashboard designed to promote services cannot succeed unless it first supports users’ daily workflows.
Process
Early assumptions and first MVP
After the beta launch of zolar Installer Services, there was no clear entry point for installation companies. Stakeholders envisioned a dashboard as a central hub where users would pass through, see the services advertised and be encouraged to engage with the SaaS.
I spoke with product, marketing, and sales teams to map their goals, define initial priorities and understand their perspectives on what the dashboard should achieve from their point of view.
We prioritized speed to deliver a functional MVP within 2 weeks (October 2024), enabling early adoption and providing users with a central entry point.
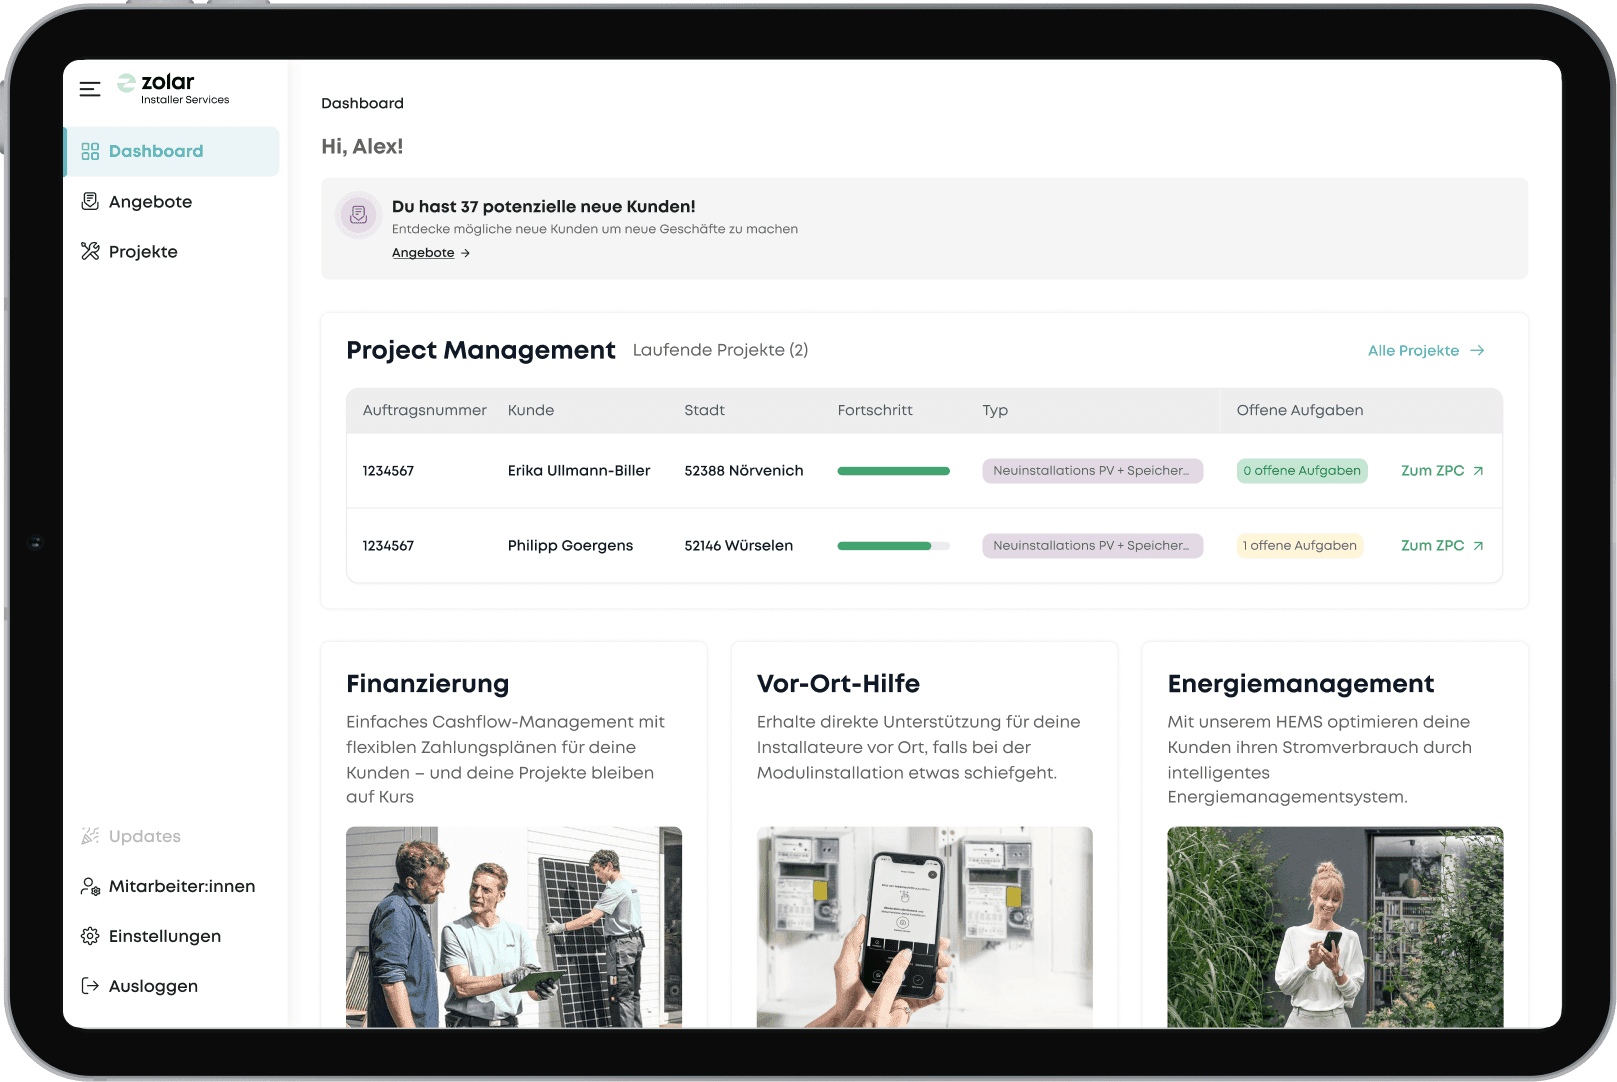
First MVP: a fast release to provide an initial entry point for beta users
Process
Early assumptions and first MVP
After the beta launch of zolar Installer Services, there was no clear entry point for installation companies. Stakeholders envisioned a dashboard as a central hub where users would pass through, see the services advertised and be encouraged to engage with the SaaS.
I spoke with product, marketing, and sales teams to map their goals, define initial priorities and understand their perspectives on what the dashboard should achieve from their point of view.
We prioritized speed to deliver a functional MVP within 2 weeks (October 2024), enabling early adoption and providing users with a central entry point.
First MVP: a fast release to provide an initial entry point for beta users
Gathering Insights and data
After the MVP release, we focused on validating assumptions and refining the design, providing incremental updates to better match installer workflows. The methods used to validate it consisted of:
Onsite field studies at installer companies, observing how teams work.
A Partner Forum with 15 participants (CEOs, planners, and sales) to test concepts and gather direct feedback.
Analysis of weekly metrics, heatmaps and video recordings tracking user engagement.

Refined iteration that was tested during the Partner Forum
This phase revealed several insights:
Users valued immediate visibility of leads and projects more than promotional content.
The PV Shop was less critical for daily workflows and was moved lower on the page.
Clear daily overviews and actionable sections were needed to reduce time spent navigating into the platform.
Gathering Insights and data
After the MVP release, we focused on validating assumptions and refining the design, providing incremental updates to better match installer workflows. The methods used to validate it consisted of:
Onsite field studies at installer companies, observing how teams work.
A Partner Forum with 15 participants (CEOs, planners, and sales) to test concepts and gather direct feedback.
Analysis of weekly metrics, heatmaps and video recordings tracking user engagement.
Refined iteration that was tested during the Partner Forum
This phase revealed several insights:
Users valued immediate visibility of leads and projects more than promotional content.
The PV Shop was less critical for daily workflows and was moved lower on the page.
Clear daily overviews and actionable sections were needed to reduce time spent navigating into the platform.
Iterative Improvements and Incremental Value
With each iteration, we incrementally aligned the dashboard closer to user needs. New sections like active projects and the Knowledge Center were added based on observed workflows. The layout was restructured to surface high-value information, while secondary content was deprioritized.
This iterative process balanced user priorities with technical feasibility, ensuring that each release delivered incremental value without overloading the team.
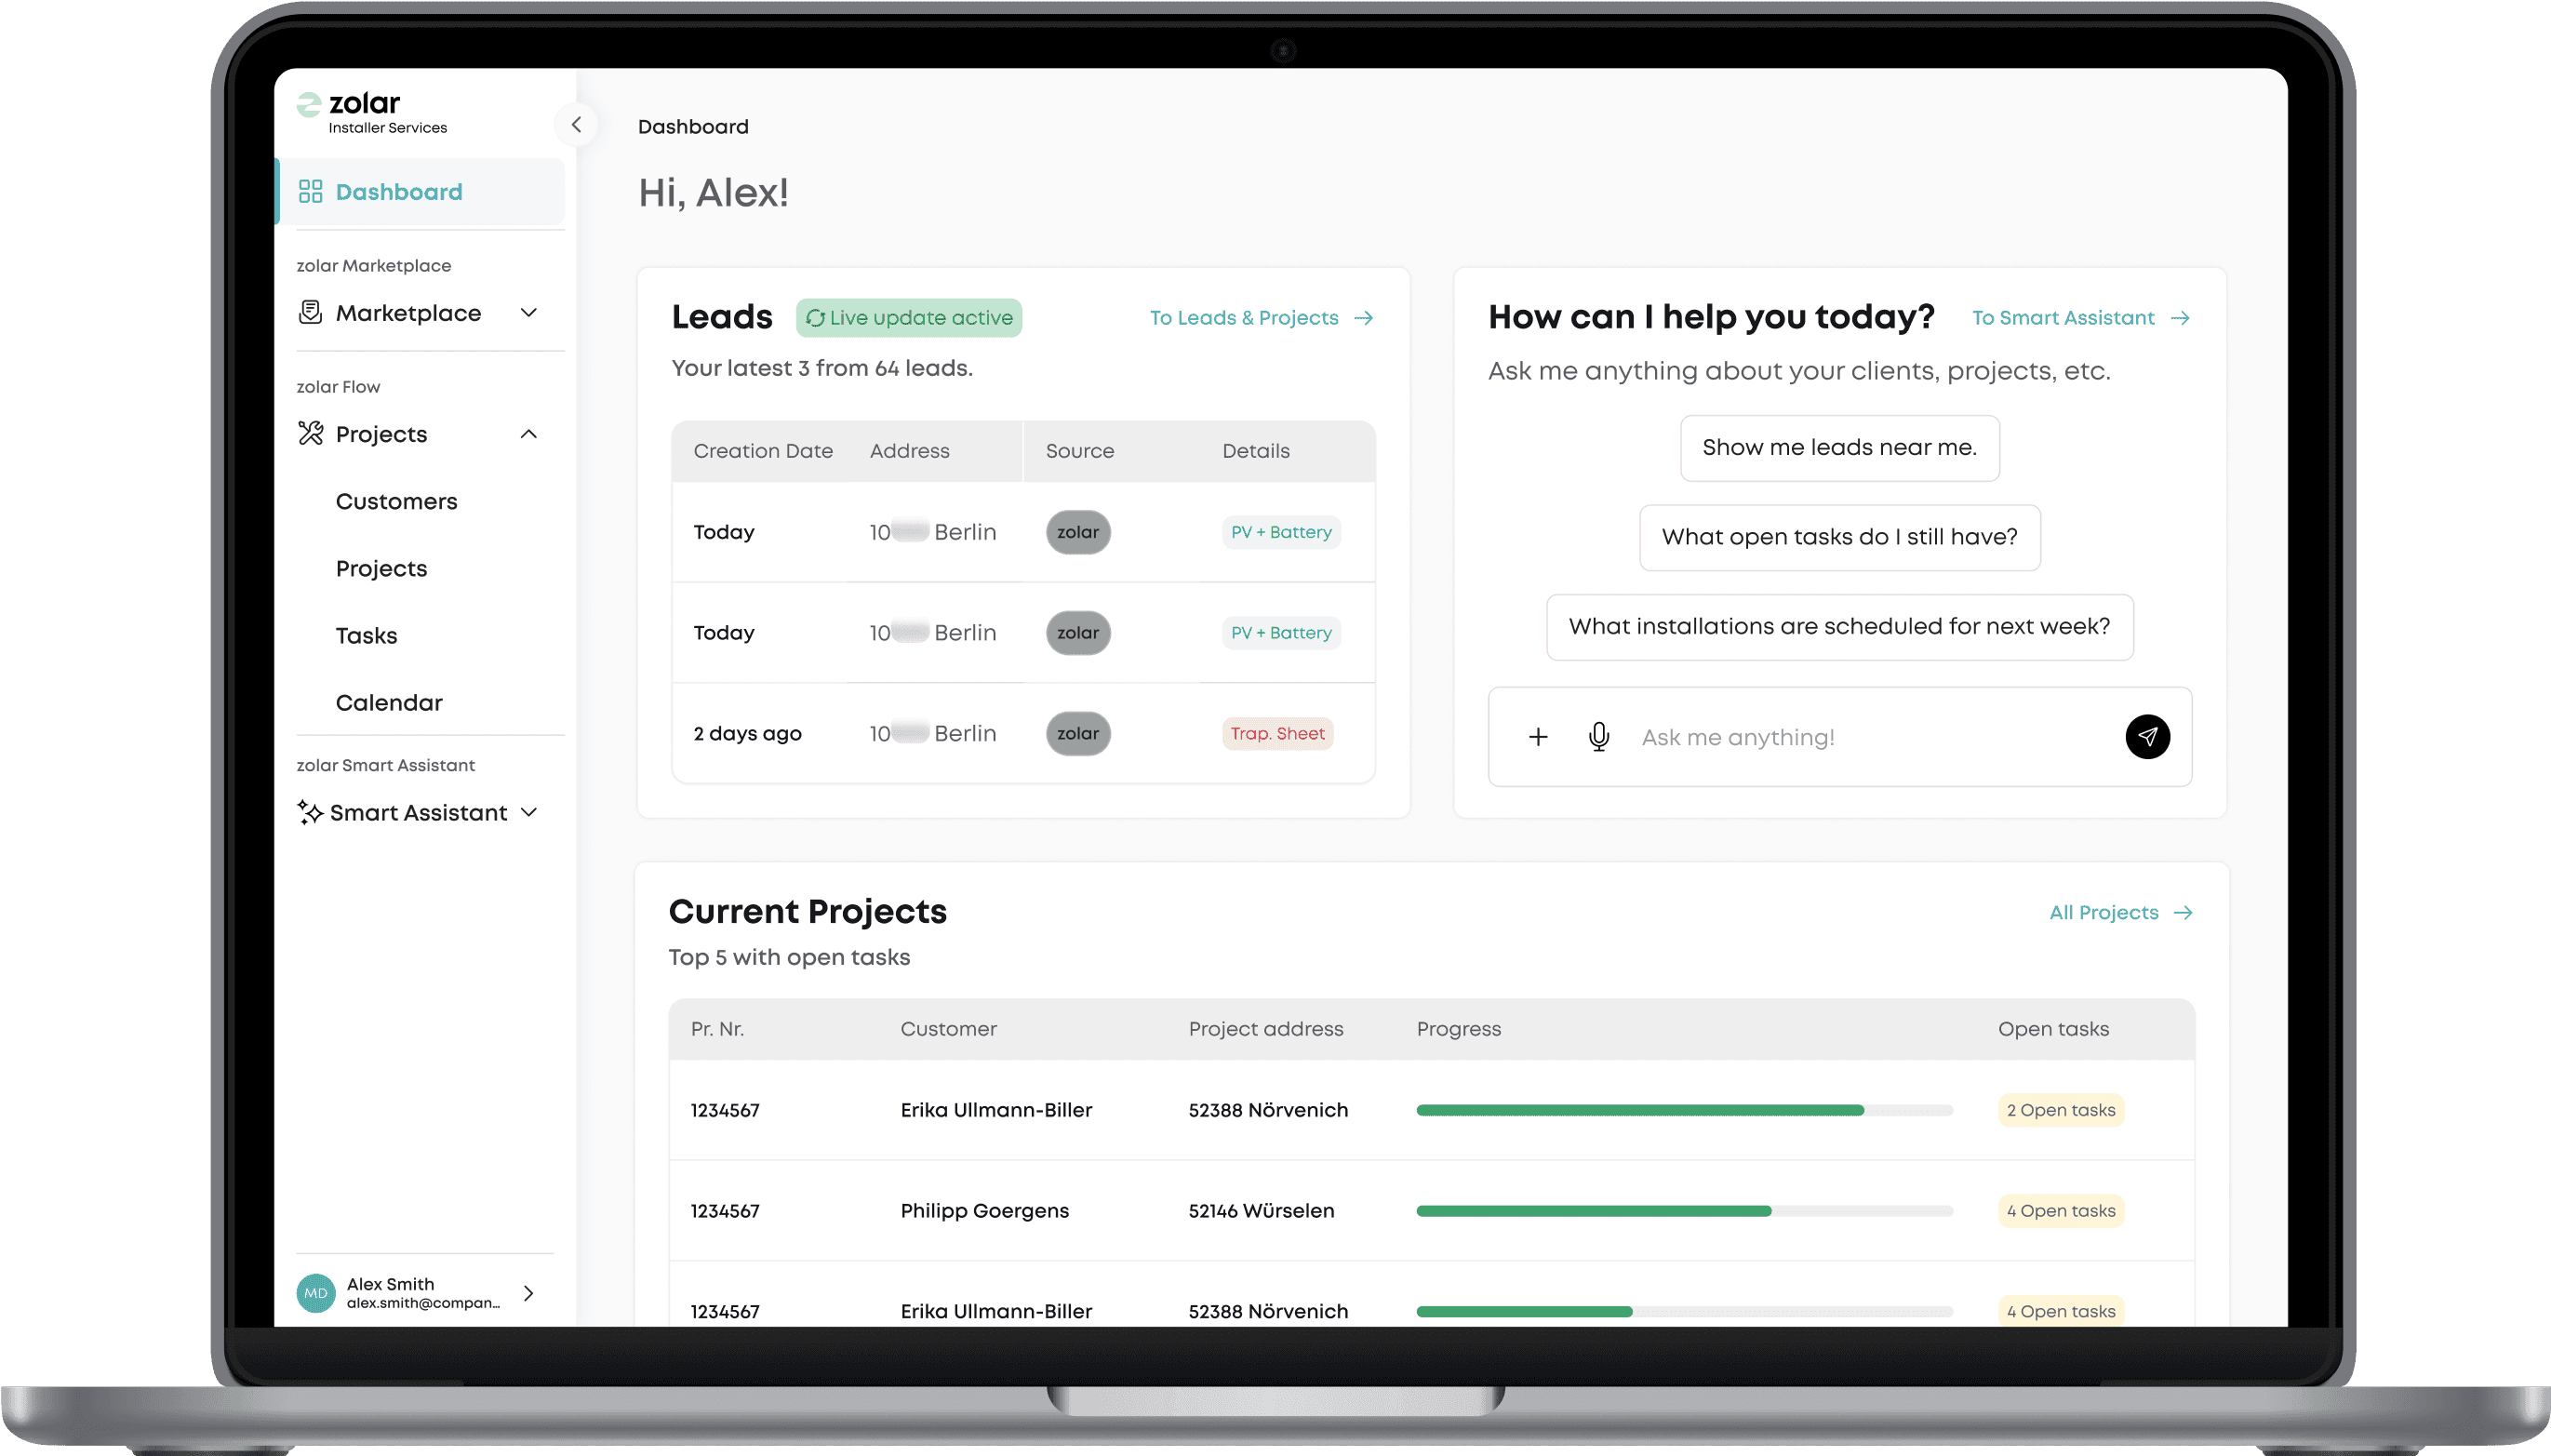
Prototype Aligned with Main User Needs
The resulting dashboard featured a clean, modular layout that balanced immediate user needs with long-term scalability. Each section was designed to provide clarity and support daily workflows.
Latest Leads preview – auto-updating to show new opportunities at a glance
Active Projects overview – quick visibility into ongoing installations
Smart Assistant – contextual actions for starting key tasks directly from the dashboard
PV Shop offers and Partner highlights – repositioned lower based on user feedback to reduce distraction
Zolar Knowledge Center – curated articles and resources to support installer operations
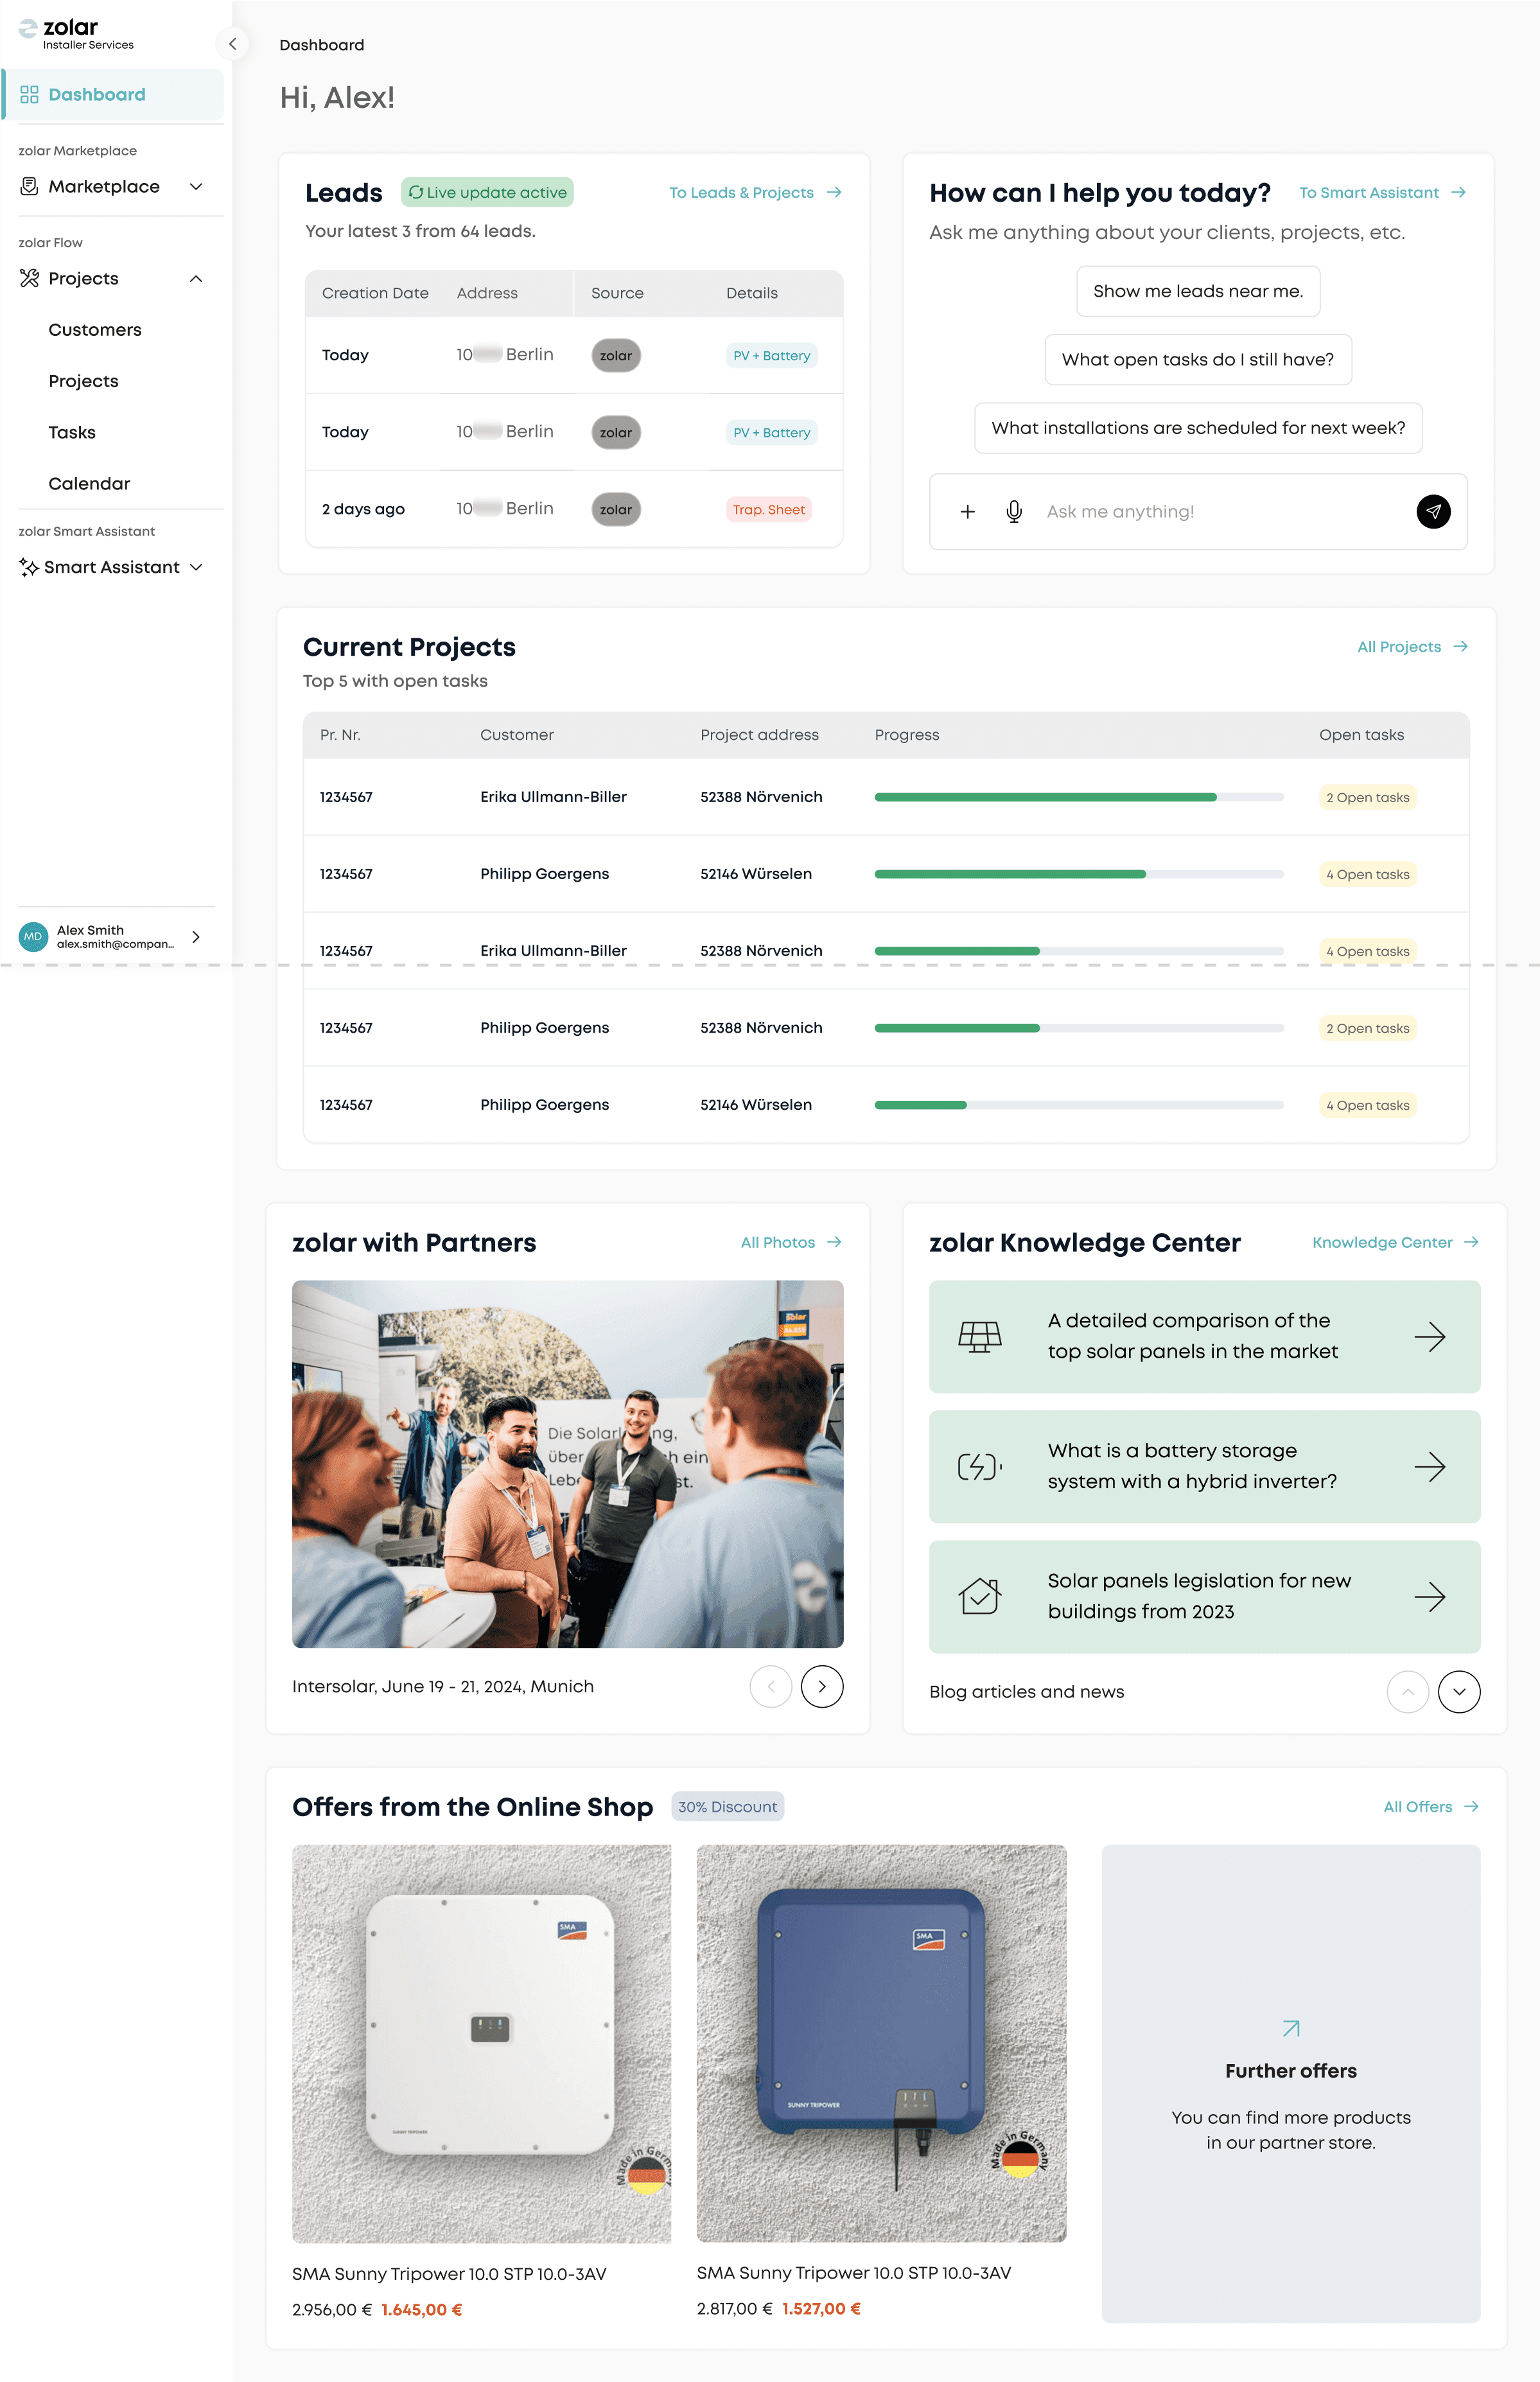
Dashboard iteration including main actions above the average fold
Prototype Aligned with Main User Needs
The resulting dashboard featured a clean, modular layout that balanced immediate user needs with long-term scalability. Each section was designed to provide clarity and support daily workflows.
Latest Leads preview – auto-updating to show new opportunities at a glance
Active Projects overview – quick visibility into ongoing installations
Smart Assistant – contextual actions for starting key tasks directly from the dashboard
PV Shop offers and Partner highlights – repositioned lower based on user feedback to reduce distraction
Zolar Knowledge Center – curated articles and resources to support installer operations
Dashboard iteration including main actions above the average fold
Outcome
The Installer Services Dashboard established a scalable foundation for zolar’s platform. It transitioned from an assumption-driven design to a user-informed product, with incremental releases aligning progressively closer to user workflows.
Outcome
The Installer Services Dashboard established a scalable foundation for zolar’s platform. It transitioned from an assumption-driven design to a user-informed product, with incremental releases aligning progressively closer to user workflows.
Outcome
The Installer Services Dashboard established a scalable foundation for zolar’s platform. It transitioned from an assumption-driven design to a user-informed product, with incremental releases aligning progressively closer to user workflows.
Learnings
This project highlighted the importance of balancing speed with research and demonstrated how iterative design can bridge business objectives and user needs effectively.
Start fast, learn fast: A rapid MVP gave us early validation and highlighted technical constraints.
User needs over internal assumptions: Field studies and usability testing set the ground to observe workflows that reshaped how features were prioritized and positioned.
Collaboration across teams: Close alignment between design, engineering, and marketing enabled scalable solutions.
Customization as a future path: Diverse user roles signal the potential value of tailoring dashboard content per role in future iterations.